Project 03
Product Search Experience with Data Visualization
Redesign data visibility to help users find and compare the data easily and make the right decisions with effective, interactive visual analytics.
The Project
Goal
Create a delightful, seamless product search experience to help users find the right products fast and make the right decisions through (re)designing navigation, product suggestion, interactive analytics, and data visualization
Scope
Phase 1: Redesign navigation, product search experience, analytics charts (2019)
Phase 2: Design product specification cards (2020)
Team & My Role
Product Manager, Developers
Me: End-to-end UX/UI Design (information architecture, wireframe, prototype
The Approach
Using a Design Thinking approach, I value in user-centric design, continuous engagement of users, and feedback in order to design a product that meets the needs of users, business, and technology.
The key to solving the problem: Listen to people, observe their behavior, and pay attention to data.

Design Thinking approach based on d.school
01 DISCOVERY
The Background
Context
It is a product comparison website and the internal analysis on user behavior revealed certain patterns that did not fully help users to compare with the right products.
While there is high volume of information and vast options of the products to select from on the website, users do not know what product(s) should be compared. Therefore, there should be additional features to help users select the right products.
Challenge
The biggest challenge is the amount of information and complexity in content that supports 15 languages; therefore, it was critical to find simple and clear solutions that help users find what they want while meeting business and technical requirements.

02 CONCEPTING
Research & Explorations

Initial Wireframes
Initial wireframes exploring possibilities and ideas for searching product steps

After feedback and iteration cycles...
Streamlined with simple, scalable solutions
03 PROTOTYPING
Design Solutions
Key Considerations
Overview: navigate users to interact with visual charts to help them make better decisions when and where the best to purchase.
Scope: Navigation, Search with product suggestions, Analytics, Property Cards
Colors: use minimally and functionally
Scalability: keep texts as simple as possible to be compatible with 15 languages. Make it “look” simple by displaying information at the right timing in the user journey even when the user comes across the most complex scenarios
Data Visibility: design carefully which information to show or hide at which step of the user journey to keep the interface simple, yet, provide appropriate information
Final Solutions
Navigation and Search Products

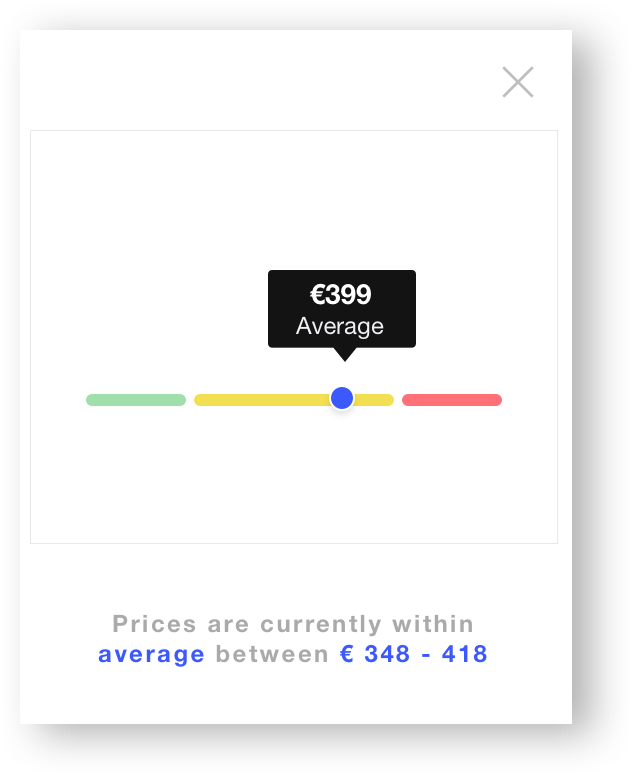
Price Analyzer
Interactive Graph: click to see data at a certain point of time
Modal window to show data in details

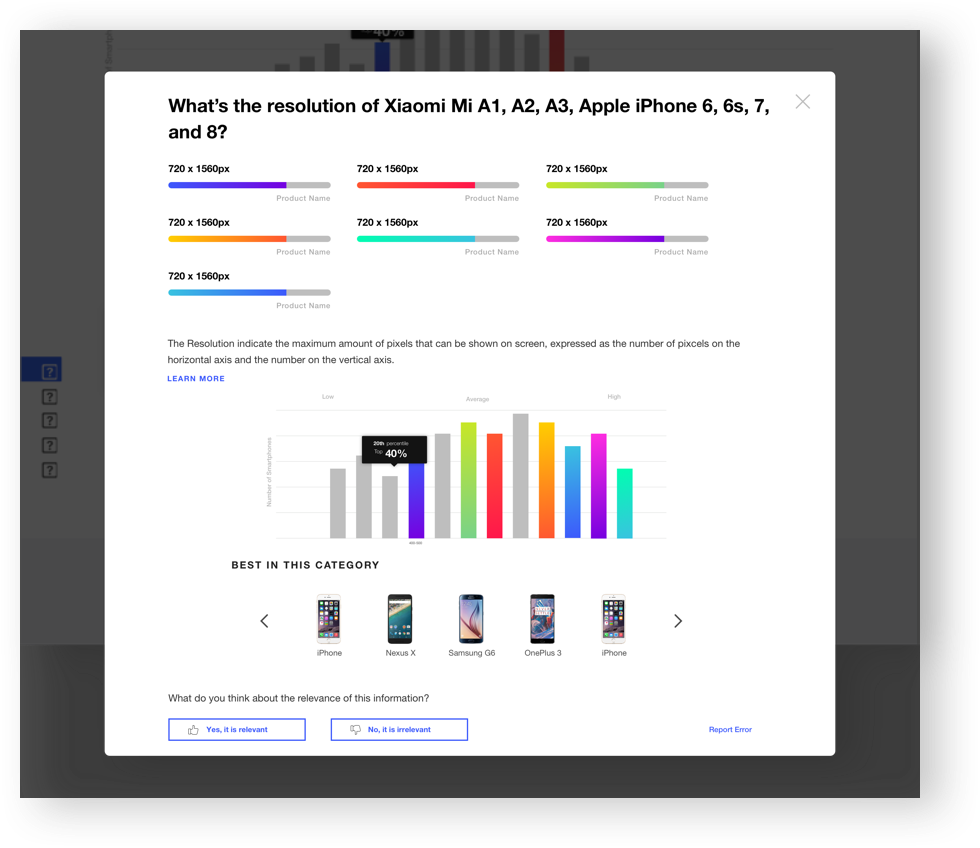
Spec Comparison
Clean, simple, and easy to find the important information for users

Design has the power to help us make better decisions when information is presented appropriately and navigate users smoothly, without “make them think”. I designed visuals carefully to display appropriate data at the right timing and be interactive with the interface.